DeepEval + Phoenix: Tracking How Agent Metrics Change Between Runs
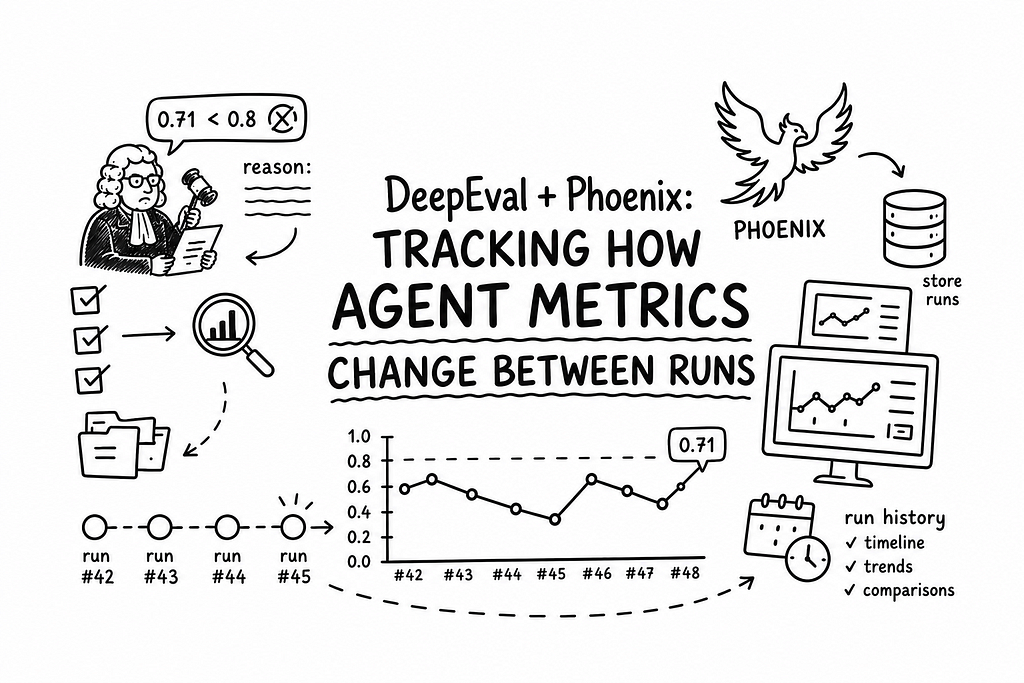
When an LLM test fails, the log holds more than a number. It holds a verdict — Answer Relevancy 0.71 against a threshold of 0.8, plus a reason from the judge that says, in plain text, what is wrong with the answer. The question “why this score” is answered on the spot. That is the whole point of LLM-as-a-judge — the score comes with an explanation.
The problem starts one line later. The score 0.71 is explained, but there is nothing to compare it against.
Because when the judge is an LLM, runs always vary. The same test against an unchanged agent gives 0.78, then 0.83, then 0.71. So when it fails, there are really two questions: is this a regression or just noise? And if it is a regression, when did it start, and after whose change?
The judge’s reason cannot answer that, and it never could. It sees one run. It honestly explains why this answer got this score, and it knows nothing about that same metric scoring 0.85 on that same test yesterday.
Without that knowledge the important part does not work — the decision. Fix the prompt, or ignore a one-off spike. Did the whole RAG category slide, or did one unlucky test fail. Did the change help, or did the run simply go well. Every one of these questions is about change over time, not about a single verdict.
Logs in CI artifacts are not history. They are raw material for it. Seeing how one metric moved means digging it out: walking through builds, lining up runs, collecting the numbers. That is doable once, but not on a regular basis.
So the task is not “find the cause” — DeepEval already gave the cause. The task is to put its scores somewhere they get a timeline, neighbours from other runs, and a way to look at a test as a line instead of a single verdict.
Phoenix can help here — it stores runs, keeps their history, and shows metrics over time.
Getting a score in there is easy. Getting history is not: Phoenix wants the data in its own shape and at its own moment, not at the one that suits the tests. So the hard part turned out to be not where to send a score, but when.
What the result should look like
Here is the working scenario that all of this comes down to.
A run finishes, and Answer Relevancy for the RAG category drops from 0.84 to 0.71. The run comparison shows that not everything fell — three tests out of twenty-four, the rest are fine. So the agent did not break; something specific did. A click on the worst delta opens its trace, and there the retriever pulled different documents than a week ago. From there it is clear where to go.
This path — from “something dropped” to “this retrieval broke” in three clicks — is the whole point of the integration.
But even in such a short scenario three different Phoenix mechanisms are involved, and each one covers a different step.
Run comparison — so that “dropped from 0.84 to 0.71” exists as a fact at all. This is experiments: the same set of tests, run after run in columns, with deltas. Runs of the same kind form a series, the series gives a line, and the line separates a regression from noise. Without this step the rest has nothing to start from.
The detail of one test — so that a delta can be opened up. This is traces: the question, the retrieved documents, the tool calls, the answer, the judging. The judge’s reason explains the score but does not show what material the agent worked with, and that is usually where the cause hides. A trace does not replace the reason; it gives it context.
Scores visible in every view — so that the first two steps get data at all. This is annotations, and it is the part nobody plans for: a score written in one place simply does not exist in the rest of the Phoenix UI. Neither trends nor category breakdowns build themselves.
Three subsystems, not three views of the same data. Each has its own API, its own life cycle, and — most importantly — its own requirements about when the data must be ready.
That is what the rest of the work was about.
Where to put the score reporting
The first decision is purely organisational, and it sets how much the integration will cost to maintain.
The most obvious option: after the scoring in each test, add a call that sends the score to Phoenix. It works, it reads well, there is no magic. There is one problem, but it never goes away: a suite has dozens of tests, and every new one has to be wrapped by hand. A month later half the metrics are missing from the dashboard — not because something broke, but because someone wrote a test and forgot the line. This approach makes sense while there are five tests.
The second option, if the tests are uniform, is to move the reporting into a pytest fixture. One autouse fixture that picks up the results after each test and sends them. It cannot be forgotten, because it applies itself. The limit is that the fixture has to get the scores from somewhere, and DeepEval hands them out at the moment of scoring — it does not collect them in one place by the end of the test. So a store of results has to exist first — and that is already the third option.
The third one, and the most durable: find the point that every score passes through, and add an extension point there. Almost every suite already has such a point — the public function the tests use to run their metrics. In our case there are two, one for a single pair and one for many:
# run.py — what already existed in the project
async def deepeval_evaluate(test_case, metric) -> DeepEvalScore:
    """Score a single (test case, metric) pair."""
    return await metric.measure(test_case)

async def deepeval_evaluate_all(cases_and_metrics) -> list[DeepEvalScore]:
    """Score multiple (test case, metric) pairs."""
    return list(await asyncio.gather(
        *(metric.measure(case) for case, metric in cases_and_metrics)
    ))
Two functions are not a problem while there are two and not twenty. What matters is that no score gets past them. In our suite the safety and quality tests call the single one, RAG and agentic call the batch one, and there is no third path.
It is tempting not to touch the core at all: monkeypatch this function (or something it calls) straight from the plugin. It looks tidy — the integration stays fully outside. That holds right up to the first from module import function in some neighbouring file: such a name is bound at import time and never sees the replacement. Some scores arrive, some do not, and the symptom looks like a network problem. After that come lint rules and guard tests, added so nobody writes the "wrong" import.
It is safer to make the extension point explicit:
# Optional observers of every score. Empty by default, so without the
# plugin nothing about the behaviour changes.
_observers: list[Callable[[DeepEvalScore], None]] = []

def add_score_observer(observer):
    """Subscribe to every score these helpers produce."""
    if observer not in _observers:       # subscribing twice breaks nothing
        _observers.append(observer)

def _publish(scores):
    """Hand the scores to the observers. One failing must not fail the test."""
    for score in scores:
        for observer in _observers:
            try:
                observer(score)
            except Exception as exc:
                logger.warning(f"score observer failed: {exc}")

async def deepeval_evaluate(test_case, metric) -> DeepEvalScore:
    score = await metric.measure(test_case)
    _publish([score])
    return score

async def deepeval_evaluate_all(cases_and_metrics) -> list[DeepEvalScore]:
    scores = list(await asyncio.gather(
        *(metric.measure(case) for case, metric in cases_and_metrics)
    ))
    _publish(scores)
    return scores
The dispatch sits in _publish so that both entry points behave the same way — otherwise it is easy to add a third function and forget the loop inside it.
After that the plugin becomes trivial:
# plugin.py — a separate file, loaded as a pytest plugin
from myproject.evaluation.run import add_score_observer, remove_score_observer

def pytest_configure(config):
    # The integration did not come up (disabled, no key, server
    # unreachable) — we simply do not subscribe.
    if not phoenix_sink.setup():
        return
    add_score_observer(phoenix_sink.record_score)

def pytest_unconfigure(config):
    remove_score_observer(phoenix_sink.record_score)
No test changed, no new test has to be wrapped, and every score now travels two paths: to the log as before, and to Phoenix.
Three decisions here, each with its own reason.
Observers are called right away, not at the end of the test. It is tempting to collect the scores and send them from pytest_runtest_makereport — it looks cleaner, all the reporting in one hook. But annotations and judge spans attach to the active span, and by the time the report hook runs that span is already closed. The scores would still arrive, and they would hang in empty space, with no link to the test that produced them.
An exception in an observer is swallowed. This is not extra caution, it is a boundary of responsibility: a broken dashboard should stay a broken dashboard. A suite that fails because Phoenix is unreachable is worse than no Phoenix at all.
Subscribing twice is ignored. pytest_configure runs once per process, but under pytest -n there are several processes, and in long sessions the hook can fire again. Without the if observer not in _observers check every score would go to Phoenix twice — in the dashboard that means duplicated annotations and inflated counters. The data looks present but is wrong, and that kind of thing is noticed late.
A plugin or just conftest
Technically all of this code could stay in conftest.py — pytest picks the hooks up from there and nothing else is needed. For one or two functions that is the right call.
But there are more hooks than that: bring the integration up at the start, name the run after collection, open a span for each test, fill in the result afterwards, flush everything at the end. Together that is a separate responsibility with its own state and life cycle. Inside conftest.py it gets mixed with the test fixtures, and six months later nobody can tell which lines are about tests and which are about observability.
So all the code lives in its own module, and conftest.py only wires it in with one line:
# conftest.py — in the project root, not in tests/
pytest_plugins = ["analytics.deepeval_phoenix"]
A side benefit: the integration can be turned off completely by commenting out one line, without touching the module itself. And removing it means deleting one file plus one line.
One trap at this step. pytest reads pytest_plugins only in the root conftest.py. In tests/conftest.py the line is ignored silently — no error, no warning. The plugin simply does not load, and it looks as if the integration does not work at all.
What record_score does
Now the whole integration comes together in one function — the one the plugin subscribed as an observer. And this is where a single score splits into the subsystems described above:
def record_score(score):
    """One score, several different places it has to reach."""
    trace_id = tracing.current_trace_id()

    # 1. Annotation on the test span: the score as a number Phoenix
    #    builds trends and breakdowns from.
    annotations.record(tracing.current_span_id(), trace_id, score)

    # 2. A separate LLM span for the judging itself: what the judge saw,
    #    what it decided, how many tokens it used. Returns that span's id.
    judge_span_id = tracing.record_judge_span(score)

    # 3. The same annotation on the judge span too - otherwise opening
    #    a single judgement shows no verdict in it.
    if judge_span_id:
        annotations.record(judge_span_id, trace_id, score, session_and_trace=False)

    # 4. A record in the experiment - one row in the run comparison table.
    if test := context.current_test():
        experiments.record(test.nodeid, score)
Four calls, four representations of the same number. Annotations give the trend, the judge span gives the detail, the experiment gives the comparison with past runs.
The important part is that none of them derives from the others. Writing a score once and hoping Phoenix will spread it across the other views does not work — why exactly will become clear below.
session_and_trace=False in the third call keeps the session and trace copies from being written twice. More on those later.
Now each subsystem in turn. The order here is the reverse of importance: traces first, then annotations, and experiments last — even though experiments are the reason for all of it.
The reason is simple: one does not work without the other.
Writing an annotation requires knowing what to attach it to. Phoenix takes a score together with a span_id — and spans are created by tracing. Without tracing there is nothing to attach the score to; in the code this is literally if not span_id: return.
Experiments rest on the same thing. Every row in the comparison table stores a trace_id, and that is what makes a delta clickable into a trace. Without tracing there is no such id, and the table turns into a set of numbers with no way to look behind them.
So they cannot be enabled separately, and the code states this openly: if tracing did not come up, the rest does not even try to start.
if not tracing.setup(settings):
    return False          # no traces means nothing else either
annotations.setup(settings)
Hence the order of the story: traces first, because everything else rests on them.
Step 1. Traces — a span tree around the test
The goal: one test equals one trace, showing every step the agent took.
Technically that means opening a parent span at the start of the test, so that all agent spans are created under it. pytest has a wrapper hook for this — it wraps the test call, so it can open a context manager before and close it after.
@pytest.hookimpl(wrapper=True)
def pytest_runtest_call(item: pytest.Item):
    """Wrap the test call in a CHAIN span so agent spans nest under it."""
    if _settings is None or not phoenix.is_enabled():
        return (yield)                    # plugin asleep — just run the test

    markers = sorted(marker.name for marker in item.iter_markers())

    with phoenix.span(
        item.name,
        kind="CHAIN",
        user_id=_agent_id(item),
        tags=markers,
        metadata={
            "nodeid": item.nodeid,
            "test_kind": kinds[0] if (kinds := _kinds(item)) else None,
            "run_name": phoenix.run_name(),
        },
    ) as test_span:
        failure: BaseException | None = None
        try:
            return (yield)
        except BaseException as exc:      # the test's own failure
            failure = exc
            raise
        finally:
            if test_span is not None:
                agent_output = phoenix.current_agent_output()
                if agent_output:
                    phoenix.set_input(test_span, _request_of(agent_output))
                    phoenix.set_output(test_span, _answer_of(agent_output))
                phoenix.set_session(test_span, phoenix.current_session_id())
                phoenix.set_user(test_span, phoenix.current_user_id())
                phoenix.refresh_metadata(test_span)
                phoenix.set_test_status(test_span, failed=failure is not None, error=failure)
Several decisions in this block deserve a closer look.
Why hookimpl(wrapper=True) and not a fixture
A fixture can also wrap a test with yield. But fixtures have their own ordering relative to other fixtures, so guaranteeing that the span opens before every agent call is harder. A wrapper hook works at the level of the pytest protocol — it is definitely outside everything the test does. return (yield) passes the test result outwards unchanged.
kind="CHAIN", and why it matters
OpenInference — the semantic convention Phoenix is built on — has a set of span kinds: CHAIN, LLM, RETRIEVER, TOOL, AGENT, EVALUATOR. Phoenix uses the kind to decide how to draw the span: for RETRIEVER it shows a document list, for LLM the prompt, the answer and the tokens, for TOOL the call arguments.
A test is not an LLM call and not a retriever, it is a sequence of steps. Hence CHAIN. With LLM, Phoenix would look for a prompt and tokens on the span, find neither, and draw empty fields.
A switch for individual tests
Every suite has tests that call the agent but score nothing — reachability checks, auth checks, any other diagnostics. They produce no scores, so all that reaches Phoenix from them is empty traces: no metrics, nothing to diagnose, but the project gets cluttered and the statistics drift.
So tracing should be possible to mute for one test at a time:
# tracing.py
_suppressed: ContextVar[bool] = ContextVar("phoenix_span_suppressed", default=False)

def suppress(value: bool) -> None:
    """Turn span recording off (True) or on (False) in the current context."""
    _suppressed.set(value)

def is_enabled() -> bool:
    return _enabled and not _suppressed.get()
Next, those tests have to be marked somehow. The simplest way is a pytest marker, which gives a chain of three links.
The marker is declared in the config, so pytest does not complain about an unknown name:
# pyproject.toml
[tool.pytest.ini_options]
markers = [
    "connectivity: smoke checks that the agent is reachable",
]
It is applied to a test or a whole class:
@pytest.mark.connectivity
class TestAgentReachable:
    ...
And it is read in the wrapper hook, before the span opens:
_NO_TRACE = frozenset({"connectivity"})   # markers that mute tracing

markers = {marker.name for marker in item.iter_markers()}

if _NO_TRACE & markers:
    phoenix.suppress(True)
    try:
        return (yield)          # the test runs as usual but leaves no spans
    finally:
        phoenix.suppress(False)
A marker is convenient because the “trace this or not” choice stays next to the test, instead of in a list of names inside the plugin.
ContextVar rather than a plain global is deliberate. A global flag under a concurrent run would mute spans for the wrong test. ContextVar isolates the value per execution context, and every span() checks it on entry:
if not _enabled or _tracer is None or _suppressed.get():
    yield None      # hand back None instead of a span
    return
The yield None is worth noting — it is the pattern that keeps the whole module tidy. When tracing is off, span() returns None, and every helper (set_input, set_output, set_session…) starts with if current is None: return. So calls inside the test need no if wrappers at all — the code looks the same whether Phoenix is on or off.
The span is born before its own session_id
The most awkward detail in this section. The agent returns session_id, user_id and run_id only after the call — they come back in the response, they are not set in advance. By then the span is already open, and already without a session, which means it links to nothing: you cannot jump from it to the Sessions tab or to neighbouring traces of the same session.
The fix goes into finally, once the session is known:
def refresh_metadata(current: Any, extra: Mapping[str, Any] | None = None) -> None:
    """Rewrite a span's metadata once the test context is complete.

    The root span opens before the agent runs, so at first it has no
    session. Called after the test to fill it in, like the child spans."""
    if current is None:
        return
    merged = {**_common_metadata(), **(dict(extra) if extra else {})}
    if merged:
        current.set_attribute(SpanAttributes.METADATA, json.dumps(_clean(merged)))
So the metadata is simply overwritten. OTel allows this — the span is not closed yet, and attributes stay mutable until the end of the with. Not pretty, but the alternative is a root span without a session, which is useless for navigation.
That leaves the question of how session_id gets from the agent back to the hook. Data moves in two directions here, and each direction needs its own mechanism.
Downwards — from the hook to the agent. The hook knows which test is running, and that has to reach all the way down to the code making the requests. A classic case for ContextVar: the value is set once and is visible everywhere down the call stack, including async tasks.
# context.py
_current: ContextVar[TestContext | None] = ContextVar("phoenix_test_context", default=None)

def set_test(ctx: TestContext) -> None:
    """Called from pytest_runtest_setup, right before the test."""
    _current.set(ctx)

def current_test() -> TestContext | None:
    """Available anywhere inside the test, including the agent's async code."""
    return _current.get()
Upwards — from the agent to the hook. Going back, ContextVar no longer works: a value set inside an async task is not visible in the outer synchronous code. The very isolation that helps in the first case gets in the way here.
So for the return direction it is a plain dict, keyed by the test’s nodeid:
# context.py
_session_id: dict[str, str] = {}       # nodeid -> the latest session
_agent_output: dict[str, Any] = {}     # nodeid -> what the agent answered

def set_session_id(session_id: str | None) -> None:
    """Called from the agent code once the answer has arrived."""
    if session_id and (test := _current.get()):
        _session_id[test.nodeid] = session_id

def current_session_id() -> str | None:
    """Read from the hook after the test - the async task is done by then."""
    if test := _current.get():
        return _session_id.get(test.nodeid)
    return None
Both functions rely on the same _current to know which test a value belongs to — but the value itself sits in an ordinary dict shared across contexts.
On the agent side the call looks like this, right after the answer, while the span is still open:
with phoenix.span("agent.ask", kind="AGENT") as current:
    run_output = await self._run(query)
    case = extract.to_single_turn(run_output, query)

    phoenix.set_output(current, case.answer)
    phoenix.set_session(current, case.session_id)   # on the span and in context
    phoenix.set_user(current, case.user_id)
    phoenix.set_agent_output({"question": query, "answer": case.answer})
set_session does two things here: it puts session_id on the current span and stores it in the context, so the hook that runs later can pick it up too.
And in the hook, after the test, the values are simply read back:
try:
    return (yield)          # the test itself runs here
finally:
    # The agent has finished, so the session and user are known.
    phoenix.set_session(test_span, phoenix.current_session_id())
    phoenix.set_user(test_span, phoenix.current_user_id())
Two different mechanisms for two different directions. It looks inconsistent until it is clear who passes what to whom: ContextVar to reach down, a plain dict to come back up.
A span’s status is not the test result
This is the most important decision in the section, and it is easy to get wrong.
The temptation: score below threshold, therefore span ERROR. The test failed, after all.
Actually no. A low score is a valid verdict from the judge. The judge looked and said “bad” — it did its job. An error is when the judge itself broke: bad config, API down, garbage instead of a number.
# tracing.py, inside record_judge_span
if error:
    judge_span.set_status(Status(StatusCode.ERROR, str(error)[:500]))
    judge_span.record_exception(RuntimeError(str(error)))
else:
    judge_span.set_status(Status(StatusCode.OK))
Merge those two cases and everything in the UI turns red, and the “show me the errors” filter becomes useless at exactly the moment it is needed — when “the agent answers badly” has to be told apart from “the scoring is broken”.
The explicit OK in the else is not accidental either. A span without an explicit status stays UNSET, which in Phoenix is a separate, undefined category. Better to close it explicitly.
The same principle applies in span(), with one nuance:
try:
    yield current
except Exception as exc:
    current.set_status(Status(StatusCode.ERROR, str(exc)))
    current.record_exception(exc)
    raise
else:
    # Do not overwrite an error the body set itself (e.g. set_error on a
    # failed tool call) — only close a still-unset span as OK.
    if getattr(current, "status", None) is None or current.status.status_code not in (
        StatusCode.ERROR,
    ):
        current.set_status(Status(StatusCode.OK))
The body of the span may have marked itself failed — for example a tool call that returned an error without raising. Overwriting that with OK on the way out would lose information.
What to put on a span so it reads well
A span by itself is an empty box with a name and a timestamp. Attributes are what make it useful, and two of them are worth setting every time.
The judge’s full input. Every judgement gets its own LLM span holding everything the judge saw: the question, the agent's answer, the retrieved context, the metric and the threshold. Plus the verdict with its reason as the output. The point is simple — two weeks later the question "why 0.71" is answered straight from the span, with no need to reconstruct the input.
Tokens and the model name go there too:
judge_span.set_attribute(SpanAttributes.LLM_MODEL_NAME, judge_model)
judge_span.set_attribute(SpanAttributes.LLM_TOKEN_COUNT_PROMPT, prompt_tokens)
judge_span.set_attribute(SpanAttributes.LLM_TOKEN_COUNT_COMPLETION, completion_tokens)
Phoenix works out the cost itself — but only if it knows the model, because its prices are per model. Without these three lines the cost of judging shows as zero in the dashboard, as if the LLM judge were free. On a large suite it is a noticeable expense, and it is better to see it.
One more detail: the function that creates the judge span returns its id, and reads it inside the with, while the span is still active:
with tracer.start_as_current_span(f"judge.{metric_name}", ...) as judge_span:
    ...
    return current_span_id()   # after the with block the span is closed
This is needed to attach the score annotation to that span later — otherwise a judgement shows up in the UI as a call with no verdict.
Retrieved documents. For RAG this is the main reason to open a trace at all: it shows whether the agent answered badly or was simply handed the wrong chunks. There is a format detail here — OTel only accepts primitives, so a list is encoded as flat indexed keys:
for index, chunk in enumerate(chunks):
    current.set_attribute(
        f"{SpanAttributes.RETRIEVAL_DOCUMENTS}.{index}.{DocumentAttributes.DOCUMENT_CONTENT}",
        chunk,
    )
Once it recognises this format, Phoenix draws the documents as a separate collapsible block. As one JSON string instead, the field turns into an unreadable blob. That is the difference between “you can see straight away that the wrong thing was retrieved” and “it is in there somewhere”.
Step 2. Annotations — why one level was not enough
An annotation in Phoenix is not a Python decorator and not a type hint. It is a separate entity: an evaluation attached to a span that has already been recorded. The span says “here is what happened”, the annotation says “here is how it was rated”. Phoenix builds its trends, breakdowns and charts from annotations, so without them a score exists only as text inside a span, not as a number that can be aggregated.
The expectation was simple: write an annotation on a span and it shows up everywhere. Sessions tab, dashboards, charts.
The reality: Phoenix does not lift span annotations up to sessions or traces. The Sessions tab is empty. The “Trace annotation scores” dashboard is empty. The scores are recorded and visible nowhere except the span they were attached to.
It does not push them down either. A score written on the test span is not visible on the child judge span, even though that judgement is what produced it. judge.FaithfulnessMetric has tokens, cost, input and output — and Annotations 0. The verdict the span exists for has to be looked up higher in the tree.
So one score is written to several places — the test span, the judge span, the session and the trace. Three separate buffers (spans, sessions, traces) plus a double write into the first one:
# annotations.py
_buffer: list[dict[str, Any]] = []
# Session-level copies of the same scores, so the Sessions tab shows them.
_session_buffer: list[dict[str, Any]] = []
# And trace-level ones, to fill the "Trace annotation scores" dashboard.
_trace_buffer: list[dict[str, Any]] = []
They are sent separately — Phoenix has its own endpoint for each level:
_client.spans.log_span_annotations(span_annotations=pending)
_client.sessions.log_session_annotations(session_annotations=session_pending)
_client.traces.log_trace_annotations(trace_annotations=trace_pending)
Duplication that exists purely because that is how the backend works, and for no other reason.
There is a catch in the double write to spans, though. The score goes to the test span (trends are built from it) and to the judge span (so the verdict is visible where it was made) — but the session and trace copies are only needed once, not twice. Otherwise the counters in the Sessions tab and on the dashboards double: the data looks present but is wrong.
So the write function takes a flag:
def record(span_id, trace_id, score, *, session_and_trace=True):
    ...
    _buffer.append({...})          # the span annotation, always

    if not session_and_trace:      # second write of the same score:
        return                     # the span part is done, stop here
    ... # session and trace copies - only from the first call
Three lines of detail, but without them the doubling goes unnoticed for a long time — the numbers are there, they are simply twice the real ones.
The shape of an annotation — three fields, three purposes
This looks like a small schema detail, but it decides whether the dashboard will be useful:
result: dict[str, Any] = {"label": "pass" if passed else "fail"}
if value is not None:
    result["score"] = float(value)
if reason:
    result["explanation"] = str(reason)

metadata: dict[str, Any] = {"threshold": getattr(score, "threshold", None)}
if error:
    metadata["error"] = str(error)
label is what Phoenix groups by. So pass/fail goes there, and a breakdown comes for free.
score is the number the charts and trends are built from. It has to be a float; a chart cannot be built from a string.
explanation is the judge's reason, the text somebody will have to read again later.
And error goes separately, into metadata, never into explanation. The reason is the same as with the span status: if a broken judge lands in the statistics as a low score, the dashboard shows it as a drop in agent quality. The agent may be perfectly fine — the judge simply ran out of quota.
Then each annotation gets context for filtering:
if test := context.current_test():
    metadata.update(
        test_kind=test.test_kind,
        test_file=test.test_file,
        test_name=test.test_name,
        nodeid=test.nodeid,
        attempt=test.attempt,
    )
if run := context.run_name():
    metadata["run_name"] = run
test_kind and run_name are what people actually filter by: "show me all RAG scores from run rag_2026-07-27_15-30". attempt is the retry number, and it matters for the next point.
Retries and multiple sessions
A test that is retried creates several agent sessions, one per attempt. If the session score is written only to the current session, all earlier attempts look in the Sessions tab like tests that somehow scored nothing.
So the score is written to every session the test touched:
session_meta = {key: value for key, value in metadata.items() if key != "session_id"}
for session in context.all_session_ids():
    _session_buffer.append({
        "session_id": session,
        "name": name,
        "annotator_kind": "LLM",
        "result": result,
        "metadata": session_meta,
    })
And the list itself is collected in the context:
def set_session_id(session_id: str | None) -> None:
    if session_id and (test := _current.get()):
        _session_id[test.nodeid] = session_id          # the current one
        seen = _all_session_ids.setdefault(test.nodeid, [])
        if session_id not in seen:
            seen.append(session_id)                     # and all of them
Two structures instead of one: _session_id for "where we are now", _all_session_ids for "where we have been". Different questions, different answers.
annotator_kind: "LLM" in all three cases tells Phoenix that the score came from a model, not a person. It has a separate type for human labels, and mixing the two in the statistics is a bad idea.
Losing scores must not fail the run
A rule worth writing directly into the code:
try:
    _client.spans.log_span_annotations(span_annotations=pending)
    logger.info(f"[PHOENIX] sent {len(pending)} metric score(s)")
except Exception as exc:
    # Lost scores must never fail a run that otherwise passed.
    logger.warning(f"[PHOENIX] failed to send {len(pending)} score(s): {exc}")
A suite that fails because a dashboard is unreachable is worse than no dashboard. The same try/except sits on all three flushes, on creating the client, and on the tracing setup.
Step 3. Experiments — where the trade-offs start
The hardest part of the integration, and the most interesting one. There are more non-obvious decisions here than in all the rest of the code together, but each has a reason — and those are the parts worth passing on.
First the data model, because nothing below makes sense without it.
Run comparison in Phoenix is built like this. There is a dataset — a set of examples. Each example has an input and an output, where the output is the expected answer. On top of the dataset an experiment is opened — one run. Inside it, each example has a run: what the system produced this time. And each run carries evaluations — the scores.
The mapping onto pytest is direct: a test is an example, a suite run is an experiment, one execution of a test is a run, the metrics are evaluations.
The key that ties everything together across runs is the pytest nodeid:
# nodeid -> dataset row id: the same test is the same row every run.
_examples: dict[str, str] = {}
One test, one dataset row, forever. The same test gives the same line on the chart no matter how many months pass. The price: rename a test or move a file and it becomes a new row, with the history cut off. A reasonable trade-off, but better learned before the first refactoring than after.
Why everything is deferred to the end of the run
Phoenix stores the reference answer on the dataset example, and it cannot be filled in after the example is created. In DeepEval the reference does not come from every metric, and not at the same time — metrics run in parallel.
So at the moment the first score is ready, it is not yet known whether this test will have a reference at all. An example created right then would stay without an expected answer forever.
The solution: send nothing immediately, queue everything.
# Scores are queued until the end of the run: an example must be created
# together with its reference, and that arrives late because metrics run
# in parallel.
_pending: list[dict[str, Any]] = []

def record(nodeid: str, score: object) -> None:
    """Queue a score; it is sent at the end of the run."""
    if _client is None:
        return
    # Cache the reference from whichever metric carries one.
    if reference := getattr(score, "expected_output", None):
        _references[nodeid] = reference
    # And the trace_id - it is only available now, during the test.
    if (trace_id := tracing.current_trace_id()) and nodeid not in _traces:
        _traces[nodeid] = trace_id
    if agent_output := context.current_agent_output():
        _outputs[nodeid] = agent_output
    if session := context.current_session_id():
        _sessions[nodeid] = session
    _pending.append({...})
There are five separate caches here (_references, _traces, _outputs, _sessions, _pending), and they all exist for one reason: the data is known during the test but needed after it. The trace_id cannot be recovered once the test finishes — the OTel context is closed. So it has to be caught now and put in a dict.
An order of operations that cannot be changed
def flush() -> None:
    """Build the dataset, the experiment and the runs, then send the scores.

    In exactly this order, so the experiment opens over a complete dataset
    version: all examples in one batch first, then the experiment over them,
    then a run per test, and only then the scores.
    """
    global _pending
    if _client is None or not _pending:
        return
    pending, _pending = _pending, []
    # 1. All examples in one batch - one dataset version.
    nodeids = list(dict.fromkeys(evaluation["nodeid"] for evaluation in pending))
    _sync_examples(nodeids)
    # 2. The experiment on top of the now-final version.
    if not _ensure_experiment():
        return
    # 3. A run per test, 4. the scores on each run.
    for evaluation in pending:
        nodeid = evaluation.pop("nodeid")
        run_id = _ensure_run(nodeid)
        if run_id is None:
            continue
        _client.experiments.log_evaluation(experiment_run_id=run_id, **evaluation)
Why this order and no other.
All examples in one batch, not one at a time as they become ready. Every batch of added examples creates a new dataset version. Thirty tests added one by one give thirty versions and a mess in the dataset history.
The experiment opens after the dataset is complete. An experiment is bound to a specific version of the dataset. Opened too early, it freezes on a half-filled version, and runs for tests added later resolve to nothing.
The symptom of that bug, if it were allowed: an empty comparison table with no errors in the log. Every API call returned 200. The favourite kind of bug — the one where everything “works”.
Plus pending, _pending = _pending, [] at the start: the queue is taken in one move, so a second call to flush() cannot send the same thing twice.
The GraphQL workaround, honestly
When the reference in a test changes (someone rewords the expected answer), a new revision of the example has to be issued. And here it turns out the public Phoenix client cannot do that: add_examples_to_dataset only adds new examples.
There is also create_dataset with an update mode that accepts an example_id. But testing showed it is not a patch of a single row — it is a replacement of the whole version's example set: pass one example and the rest disappear from the dataset. To update the reference of one test you would have to fetch and resend all 60+ examples every time, and each call would create a new version.
Hence a raw GraphQL mutation — the same internal API the Phoenix web UI uses.
def _patch_reference(example_id: str, reference: str) -> None:
    """Update an existing example's reference through GraphQL — the REST
    client can only append examples, so a change needs this path."""
    mutation = (
        "mutation($id: ID!, $exampleId: ID!, $output: JSON!) {"
        " patchDatasetExamples(input: {datasetId: $id,"
        " patches: [{exampleId: $exampleId, output: $output}]}) { __typename } }"
    )
    variables = {
        "id": _dataset_id,
        "exampleId": example_id,
        "output": {"expected_output": reference},
    }
    try:
        response = _client._client.post(
            "/graphql", json={"query": mutation, "variables": variables}
        )
        response.raise_for_status()
    except Exception as exc:
        logger.warning(f"[PHOENIX] could not update reference for example {example_id}: {exc}")
Yes, _client._client reaches into the private httpx client inside the public Phoenix client. Yes, the GraphQL mutation is hardcoded as a string.
This is a deliberate trade-off. It will break on a Phoenix upgrade, and that is exactly why the docstring above it explains the reason — so whoever hits it after an upgrade understands in thirty seconds rather than an hour. Plus the try/except with a warning: if the mutation breaks, the reference is not updated, but the run still finishes.
Whether a reference actually changed is decided through a separate cache of what is currently on the server:
# nodeid -> the reference now stored on the server, to detect a change.
_stored_references: dict[str, str | None] = {}

for node_id in nodeids:
    reference = _references.get(node_id)
    if (
        node_id in _examples
        and reference is not None
        and reference != _stored_references.get(node_id)
    ):
        _patch_reference(_examples[node_id], reference)
        _stored_references[node_id] = reference
Without that check every run would create a new revision of every example, even when nothing changed. The dataset history swells for no benefit at all.
The link from the comparison table into a trace
One detail that makes experiments genuinely useful instead of just a table of numbers:
run = _client.experiments.log_run(
    experiment_id=_experiment_id,
    dataset_example_id=example_id,
    output=output,
    # Link the run to its trace: retrieval and tool calls one click away
    # from the comparison table.
    trace_id=_traces.get(nodeid),
    start_time=now,
    end_time=now,
)
This is the same trace_id that was caught during the test. Now in a table showing "0.85 yesterday, 0.71 today" the 0.71 is clickable into the trace, where you can see which documents were retrieved and what the agent answered. Without that link you would have to hunt for the matching trace by timestamp and test name, and the convenience ends right there.
Parallel runs and experiments
Under pytest -n each worker is a separate process with its own state. All those dicts — _examples, _pending, _experiment_id — exist per worker. So each worker would open its own experiment, and the output would be eight experiments with part of the tests in each, instead of one complete run.
Merging them would require cross-process coordination: a file lock, or passing experiment_id through workerinput. That is not done.
def pytest_collection_finish(session: pytest.Session) -> None:
    ...
    if _is_xdist(session):
        # Warn from the controller only, so it is logged once, not per worker.
        if not _is_xdist_worker(session):
            phoenix.log_experiments_skipped_under_xdist()
        return
    phoenix.setup_experiment(_settings, run, [item.nodeid for item in session.items])
Under xdist, experiments are simply off. Traces and annotations keep working — they share no state, each worker exports its spans to the same project, and that is correct. The warning is logged once from the controller rather than from every worker, because eight identical warnings add nothing.
Fixing it is possible: the controller creates the experiment, hands experiment_id to the workers through workerinput, and one of them does the final flush. Half a day of work plus a new class of bugs — races when creating the dataset, partial flushes if a worker dies.
Instead the choice was moved into the interface — two targets with two different promises:
px-all:           # sequential: traces + scores + experiments
    pytest -v

px-all-parallel:  # parallel: traces + scores, experiments off
    PHOENIX__TRACK_EXPERIMENTS=false pytest -v -n auto
A quick check over the full suite goes to the parallel target. Run comparison goes to the sequential one. The limitation has not gone anywhere, but it stopped being a surprise: it is visible in the command name instead of a warning buried in the logs.
Naming a run
A small thing that decides whether the history will still be readable in three months:
# Markers that name a test category — every project has its own.
KIND_MARKERS = frozenset({"rag", "agent", "safety", "conversation", ...})

def category(kinds: set[str]) -> str:
    """The run's category: the single kind if there is one, otherwise 'all'."""
    present = kinds & KIND_MARKERS
    if len(present) == 1:
        return next(iter(present))
    if present:
        return "all"
    return "run"

def build_run_name(kinds: set[str], now: datetime | None = None) -> str:
    """"<category>_<timestamp>", e.g. "rag_2026-07-27_15-30"."""
    stamp = (now or datetime.now()).strftime(_TIME_FORMAT)
    return f"{category(kinds)}_{stamp}"
The name is built from what was actually selected for the run, using the markers of the collected tests. Only RAG selected — the run is called rag_.... Everything selected — all_....
The point: runs of the same kind (rag_*) group into one series, and the timestamp keeps them apart. The trend appears on its own, with no manual labelling. Seconds are left out on purpose — minute precision is enough and the name stays shorter. Dashes instead of colons keep the name safe in a URL.
And there is a way out of the default through RUN_NAME=, when a run needs a human name:
make px-all RUN_NAME=before-fix
# ... changes ...
make px-all RUN_NAME=after-fix
Then the comparison table has two columns with meaningful names, instead of two timestamps that have to be remembered.
What it looks like in practice
Running it is no different from a normal run — the same pytest command, plus the integration switched on:
# client-side dependencies only (the tracer and the client, not the server)
uv pip install "arize-phoenix-otel" "arize-phoenix-client"

# Phoenix itself runs separately, in its own container
docker run -p 6006:6006 arizephoenix/phoenix

# .env
PHOENIX__ENABLED=true
PHOENIX__ENDPOINT=http://localhost:6006/v1/traces

# and an ordinary run of one category
pytest -m rag
The run names itself from the markers of what was selected: rag_2026-07-27_15-30. When something specific has to be compared, the name is set by hand:
PHOENIX__RUN_NAME=before-fix pytest -m rag
# ... prompt changes ...
PHOENIX__RUN_NAME=after-fix  pytest -m rag
After that comes the scenario this article started with, only now it actually works.
In Phoenix, the Datasets tab opens a table: rows are tests, columns are runs, cells hold scores with deltas. Answer Relevancy did not drop everywhere — only on three tests out of twenty-four. That is already a diagnosis: the agent did not break, something specific did.
A click on the delta leads into that run’s trace. There the tree opens up: the question, the retrieval with its chunks, the tool calls, the answer, the judging with its reason. Comparing it with the previous run’s trace shows the retriever pulled different documents.
Three clicks from “something dropped” to “this retrieval broke”. That is what all of it was for.
Separately there is the Sessions tab, where the same scores sit on the agent’s sessions, and the dashboards with trends by test_kind. That part is filled by the annotations written at several levels, and it would not work if the score were written in one place only.
If you are doing the same thing
The article is about one specific pair of tools, but the order of steps carries over almost unchanged.
One entry point, made explicit. Start with the function every score passes through; usually it is the one the tests use to run their metrics. Add a list of observers to it — a few lines that change nothing until somebody subscribes. The temptation to monkeypatch something instead and leave the core untouched looks cheaper right up to the point where lint rules have to be added so that the patch does not break because of somebody’s import.
Not everything at once. The minimum useful version is traces plus annotations: what happened inside a test is already visible, and the scores land in the dashboards. Experiments with run comparison come next, once the first part works.
Assume the data arrives at the wrong time. This is the main lesson of the whole exercise. Session ids, reference answers, trace ids — all of them become known at different moments, and almost every workaround in the code above grew out of that. Caching “catch it now, use it at the end of the run” is a normal pattern, not a hack.
A kill switch from day one. One flag, and with it off the suite must behave exactly as before. Otherwise, a month later an unreachable dashboard starts failing tests, and it will be exactly the day something has to ship urgently.
So was it worth it?
The biggest change is not in the dashboard. It is in how failures get discussed.
A red test used to start a conversation based on guesses: one person thinks it has been like that for ages, another thinks it broke yesterday, and neither side has anything to back it up. Now it is a question that closes in half a minute: open the table, look at the line. Either it dropped after a specific change, or it has been swinging all month.
The second change is that the scale is visible. “Three tests out of twenty-four” and “the whole category” call for different reactions, and in the logs they look identical: a pile of red lines somebody still has to count by hand.
What is still awkward, stated plainly. The GraphQL mutation will break on a Phoenix upgrade. The root span’s metadata is rewritten after the fact. One score has to be written four times — test span, judge span, session, trace — because the backend neither lifts annotations up nor pushes them down the tree. Renaming a test cuts the dataset history. Parallel runs and run comparison are mutually exclusive, so the choice is made by picking a target. Around fifteen hundred lines for something that conceptually sounds like “send a score to a service”.
And the conclusion that carries over to any other pair of tools.
The difficulty was not where it was expected. Both tools have decent APIs, documentation and examples — connecting them really is a matter of a few lines. But an integration only becomes useful once you account for which data exists at which moment. The reference does not appear when the dataset row is created. The session id does not appear when the span opens. Metrics are computed in parallel and know nothing about each other.
Almost every workaround in this code grew out of that mismatch. Not out of a bad API, but out of two systems disagreeing about when the data is ready.
DeepEval judges. Phoenix remembers. All the work sits between those two verbs.